Reading Shot Maps Before You Back a Team
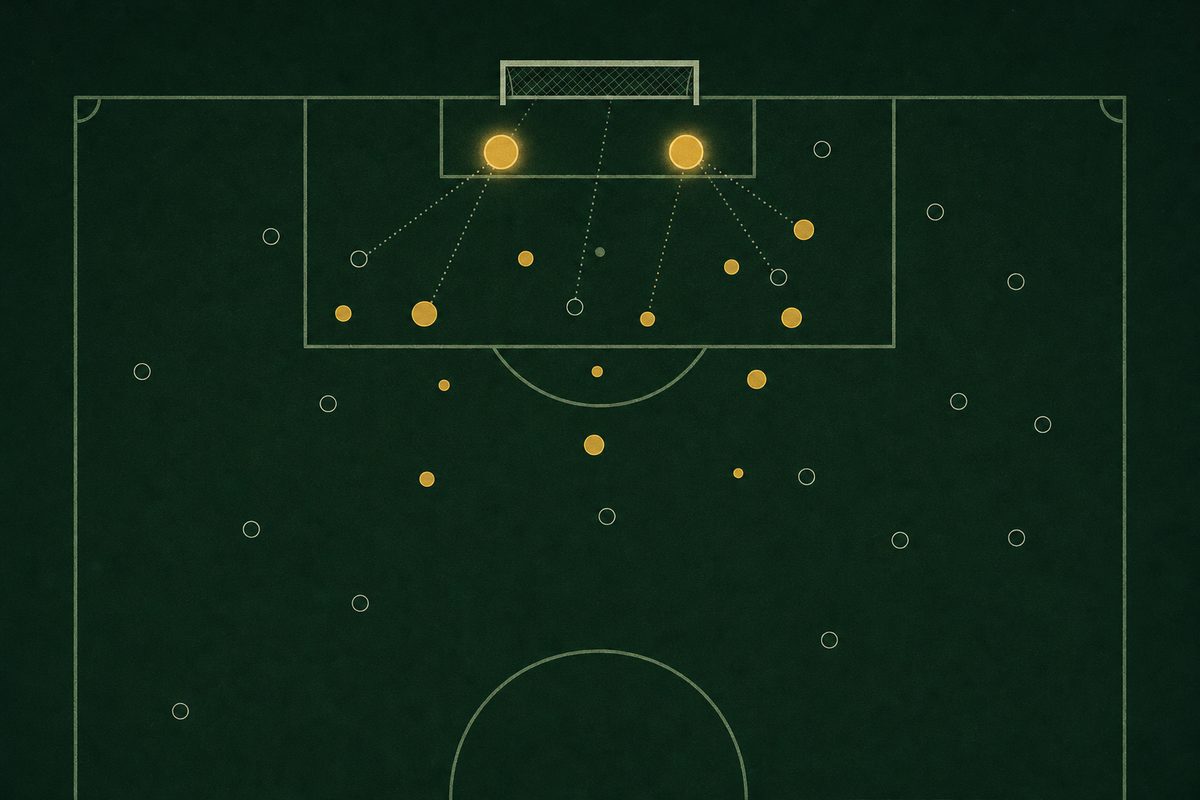
A final score is the least informative number a football match produces. It tells you who won, and very little about whether they deserved to or whether they will do it again. Anyone who follows a team closely, or is deciding which side to back in an argument, a fantasy draft or a Saturday afternoon prediction, gets more out of the record underneath it: how many shots each side took, how many of them were on target, and what the previous five matches looked like.
Start with volume, then check the quality
Shot volume is the first thing a shot map shows and the easiest to over-read. Across the 380 matches of the 2024/25 Premier League season, teams took 9,849 shots between them and scored 1,115 goals. That is one goal for roughly every nine attempts. A side that has twenty shots in a match has not necessarily played well; it may have taken fourteen of them from 25 yards because it could not get any closer.
Shots on target are the better filter. Of those 9,849 attempts, 3,458 — about 35 per cent — forced a save or went in, and close to one in three of those became a goal. A team that keeps landing five or six on target per match is creating chances a goalkeeper has to deal with, which is a sturdier signal than raw volume.
- 9,849shots in the 2024/25 Premier League
- 35.1%of them on target
- 0.32goals per shot on target
- 0.11goals per shot of any kind
Where the dots sit matters more than how many there are
A proper shot map adds location, and location is what expected-goals models are built on. A shot from inside the six-yard box is converted far more often than one from the edge of the area, and a header from a corner less often than a low cut-back finished first time. Opta's explanation of expected goals sets out how those factors are weighted. Even without a model, the eye test works: a cluster of markers around the penalty spot says more about a team's attack than a spray of long-range efforts.
The match archive here does not record shot positions, only counts, and that limitation is worth keeping in mind. A count can tell you that a team was busy; it cannot tell you whether it was dangerous. Treat the two figures together — shots and shots on target — as the closest substitute.
The outshot-and-lost problem
The most common misreading of shot data is assuming the side with more shots was the better side. In 2024/25 there were 140 occasions when one team took at least twice as many shots as its opponent. On 58 of them, a little over 41 per cent, the team with the shot advantage failed to win. Some of those were deep-lying sides content to defend a lead; some were simply finishing that did not go in.
The Valencia v Málaga match page from January 2011 is a useful example of reading the two together. Valencia had 15 shots to Málaga's 9 and won 4–3, but on target it was only 7 to 6 — much closer than the raw shot count suggests, and the score reflected it.
Shots on target are a steadier guide. In matches where one side had more on target than the other, that side won 59.6 per cent of the time, drew 23 per cent and lost 17 per cent. It is a tendency, not a law, which is exactly why a single match should never settle an opinion.
Form is a sample, not a verdict
The five-match form line — W W D L W and so on — is the other number everyone checks first. It is useful as a summary and misleading as evidence, because five results are a small sample shaped by the fixture list. Three wins against the bottom three and two defeats away to the top two is not the same form as the reverse, though it prints identically.
A better habit is to set the form line beside the shot record for the same five matches. A team winning while being outshot is running hot and tends to come back to earth; a team losing while dominating shots on target is often closer to a turnaround than its results suggest. Over a full season the gap closes, which is why the league-by-league season tables show far fewer surprises than any single month does.
The same discipline carries over to other sports. Hockey analysts lean on shot attempts and save percentage in much the way football analysts lean on shots on target, and readers comparing the best hockey betting sites in Canada will find the National Post's hockey betting guide works from a similar view that one night's score is noise and the underlying shot record is the signal.
Putting it together before a match
A sensible reading before a fixture takes four steps. Look at the shots on target each side has produced and conceded over its last five matches, not the results alone. Check whether the shot totals are being inflated by long-range attempts, if location data is available. Compare the form line against those numbers to see which teams are over- or under-performing. Finally, look at how the two clubs have fared against each other over a longer stretch: the head-to-head record for any pairing in the archive lists every league meeting, which puts a single recent result in proportion.
None of this predicts a score. What it does is replace the first impression — who won last week, who has the bigger name — with the record of what actually happened on the pitch, which is the only thing a statistics archive can honestly offer.